The Dynamics of the Oil and Gas Market
Since the mid-20th century, Crude Oil has been the most traded commodity in the world, with a global annual trade value of $ 3 Trillion in 2024, attracting investors from the public markets and governments to capitalize on its price volatility. This volatility is a result of complex interactions between factors like supply-demand dynamics, inventory and storage, geopolitics, and policy changes. In this week’s article on the market dynamics of the Oil & Gas industry, we will delve into history, chemistry, important industry metrics, economics, and market dynamics (oil futures: contango and backwardation).
ENERGY INDUSTRYMOST RECENT
Sumedh Joshi
1/25/20267 min read


History of the Oil and Gas Industry
Oil exploration in the 1850s was an expensive endeavor that only a handful of businessmen and technologists undertook purely out of curiosity, oblivious to the fact that this could one day power the entire world. In 1859, the first commercially successful Drake oil well in Pennsylvania, using a cable-tool percussion drilling technique, found oil 60 feet beneath the ground, marking the beginning of the foundational era of the industry. The real mass commercialization was realized in 1901 when an oil well in Beaumont, TX, blew oil at a flow rate of 100,000 barrels/day, record-breaking at that time. While the 1910s oil production and supply were dominated by the Standard Oil Company, a landmark US Supreme Court decision broke the Oil Giant into regional successors that transformed the industry from a monopoly to an oligopoly, which was essential for competitive pricing and efficient market dynamics for decades to come. Later, the World Wars showed the world the importance of oil as an energy asset.
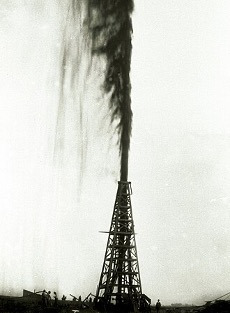
Lucas Gusher: Spindletop, Beaumont, TX
In the 1960s, seismic technology and offshore engineering helped discover the Ekofisk oil field, a giant subsea chalk reservoir, and many other major offshore oil fields. The 1960s also saw a geopolitical shift when OPEC (Oil-Producing and Exporting Countries) was formed, and later inthe 1970s, the Oil Crisis led to the emergence of ideas like fuel efficiency and energy asset diversification. The infamous 1969 Santa Barbara blowout led to the formation of what we now call the EPA (Environmental Protection Agency) to address the environmental risk posed by industry operations. Enhanced oil recovery in the 1970s bolstered the production capacity. The early 2000s saw a combination of modern techniques like horizontal drilling and multistage hydraulic fracturing catalyzing what is called the Shale revolution, where production capacities increased significantly. In 2015, the US lifted the crude export ban and reconnected the WTI (Western Texas Intermediate) to the world markets. This helped bring the exploration and production cost of oil down. The 2020s saw an unpredictable market due to the Covid Pandemic, where the oil prices settled in the negative range.
To summarize, the oil and gas industry has shown high sensitivity towards world events and geopolitics in the past, but the technological advancements have created new exploration opportunities, significantly reduced the breakeven costs of setting up operations, and contributed to efficient processes of extracting useful downstream products.
Let us now focus on the current production metrics of the Oil and Gas market.
Oil and Gas Production
The global oil and other liquid production hit 105 million barrels/day (mmbpd) in 2025. This constitutes crude oil, condensate, natural gas, refined products like jet fuel, and biofuels.
Crude Oil: This is the bulk of the supply stream. Crude oil is differentiated based on the grade based on the API (American Petroleum Institute) gravity metric. These range from light (sweet) to extra heavy crude (sour), where the former is less dense, has low viscosity, contains low amounts of sulfur and yields more gasoline. Below is a table outlining the characteristics of the types of crude oil.
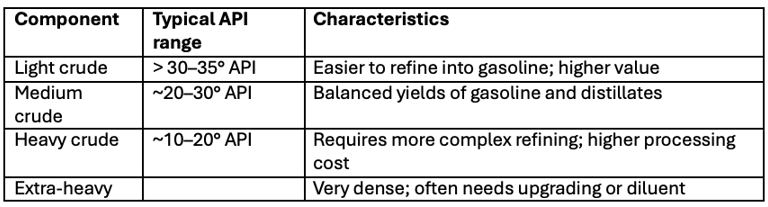

Sources: Classification and API ranges from industry references and state geological services.
The US has huge reserves of light or sweet crude oil, which are easier to process. These come from the Permian (Texas, New Mexico), Bakken & Williston (North Dakota/Montana), Eagle Ford Shale (South Texas) basins. Heavy oil is usually imported from other countries, as the US has extensive modern infrastructure to process these types of sour oils.
Condensate: Very light hydrocarbons separated from gas wells, often blended into light crude streams or used as a diluent.
Natural Gas and Liquids: Liquids like propane, butane, and natural gas that are sold into petrochemical, heating, or blending markets.
Refined Products: Direct deliveries of gasoline, diesel, jet fuel, etc. that bypass crude refining in some supply chains.
Biofuels: Renewable blendstock added to transport fuel pools.
Other: Captures measurement differences, refinery processing gains, and losses in transit.
The following table shows the 2025 EIA estimates of the US oil and gas production.
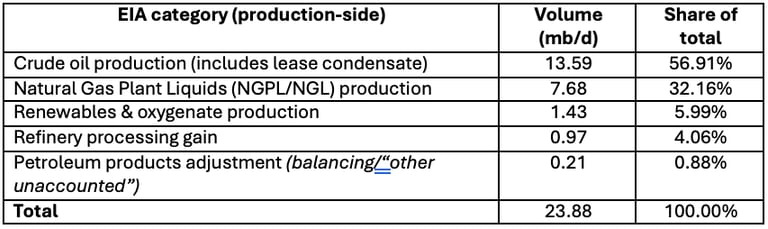
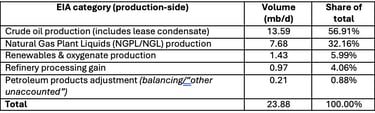
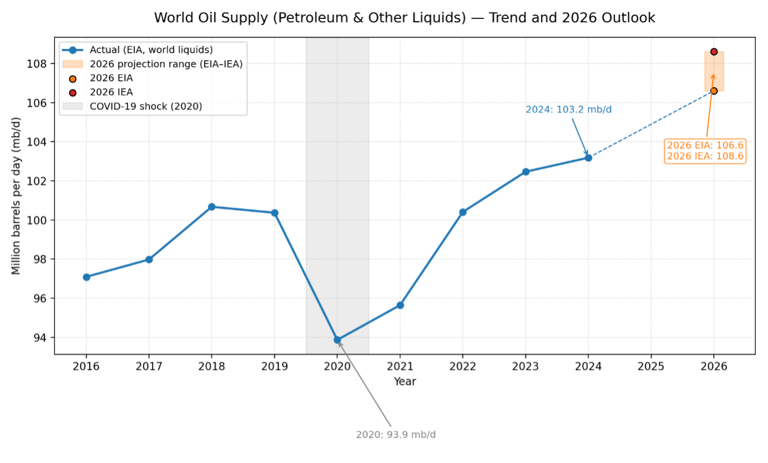
The US produces around 23.88 mmbpd of oil and gas products, making it the largest producer and exporter of crude oil and liquefied natural gas on the globe. The globe, in totality produces around 105 mmbpd (2025) of oil and gas products and this is expected to rise to 106-108 mmbpd, according to certain estimates. The image below shows a 10-year trend of the global oil and gas products supply.
Oil & Gas Supply-Demand
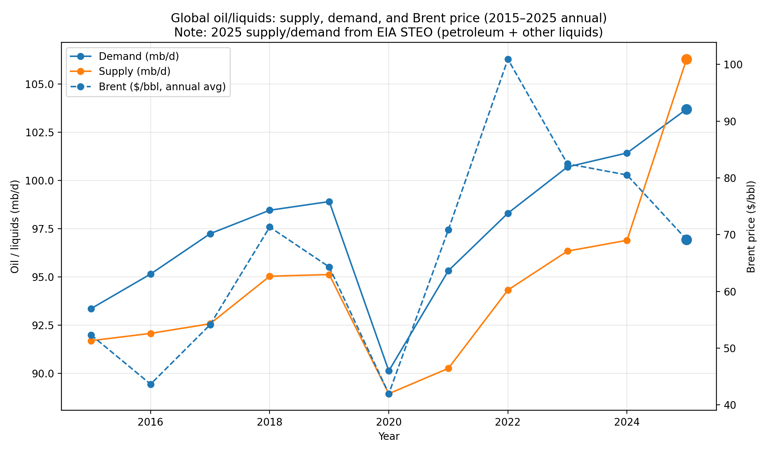
The oil production has been steadily going up with increased crude production and more oil sitting in floating storage. More so than in the past, oil and natural gas are increasingly seen as economic drivers for developing countries due to lower costs, abundant supply, and rising infrastructure. Natural gas, in recent years, has been pushed into increased adoption as a low-carbon fuel and is often referred to as the “transition fuel.” For illustration, the supply-demand of oil and natural gas in the last decade is shown in the figure below. The demand for end-use products like gasoline, diesel, jet fuel, and feedstocks has gone up steadily in the past couple of years. This can be linked to the GDP growth, expansion of manufacturing, and industrial chemical demand. Other factors like the transition from coal to gas, changing heating/cooling needs during peak periods, seasonality, and policies also have an impact on the demand of oil products.
In order to understand the complex supply-demand interaction, it is important to see the relation between oil prices and important events that influence either the supply or the demand. In the figure below, we have the Brent Prices, average yearly supply, and demand for the last decade. In 2016, despite rising demand, Brent prices dropped from the 2015 levels as there was an earlier oversupply and high inventories, highlighting the important relationship between inventories and oil prices. Brent gained going into 2017 with rising demand as compared to supply. A black swan moment materialized in 2020 during the global pandemic, when demand suddenly dropped, and producers reduced production to avoid losses, sending the price down. As the world got acquainted with the new normal, prices recovered in 2021 with a steady demand increase. 2022 saw some geopolitical tensions, and prices skyrocketed due to uncertainty over supply. 2023-24 saw the prices drop as supply caught up with a production increase from non-OPEC entities. 2025 saw the supply outpacing demand, and as a result, oil prices dropped.
Some key takeaways from the above analysis are as follows:
1. Oil price is set at the margin: Even a small mismatch between supply and demand can swing inventories and move prices sharply because both are relatively inelastic in the short run.
2. Demand is “sticky” but cyclical: Transport and petrochem demand don’t respond quickly to price, but they do respond to GDP/industrial cycles and demand shocks (2020) dominate price.
3. Supply reacts slower than demand: Upstream projects take months/years, so short-run rebalancing happens through inventory and OPEC+ policy, not instant production changes.
4. OPEC+ is the swing mechanism: In surplus periods, OPEC+ cuts can slow inventory builds; in tight periods, spare capacity decisions determine how quickly deficits are relieved.
5. Non-OPEC growth drives the baseline: U.S. oil and a few offshore provinces (Brazil/Guyana/Canada) often determine whether the market ends up long or tight.
6. Inventories are the “shock absorber”: When supply exceeds demand, barrels go into storage; when demand exceeds supply, stocks draw. The direction and pace of inventory change is the most practical tightness signal.
7. Refining can be the hidden constraint: Crude can be abundant while products are tight if refinery capacity/utilization is constrained.
8. Logistics matter (especially for benchmarks): Storage and pipeline constraints can distort local prices (e.g., WTI vs Brent differentials), affecting global price signals and spreads.
9. Geopolitics often changes the distribution more than the total: Outages/sanctions can tighten specific grades/regions, widening differentials even if global supply is adequate.
10. Seasonality is real: Driving season, winter heating, and refinery maintenance create predictable swings in demand and product tightness that show up in spreads and cracks.
Oil and Gas Futures Analysis
It is interesting to learn about Contango and Backwardation, which drive near-term oil and gas future prices. Contango occurs when the market prices later‑dated contracts above near‑term contracts, often because storage, insurance, and financing costs make holding the physical commodity expensive, or because the market expects ample future supply. Backwardation happens when the spot price exceeds futures prices, signaling a near‑term premium for immediate delivery.
To simplify,
If storing oil is costly, futures must rise to compensate holders; that pushes the curve into contango.
When having the physical commodity today is valuable (e.g., for refiners), that raises spot relative to futures and can create backwardation.
If traders expect oversupply, contango is more likely; if they expect shortages, backwardation is imminent.
Let us understand this concept using an example.
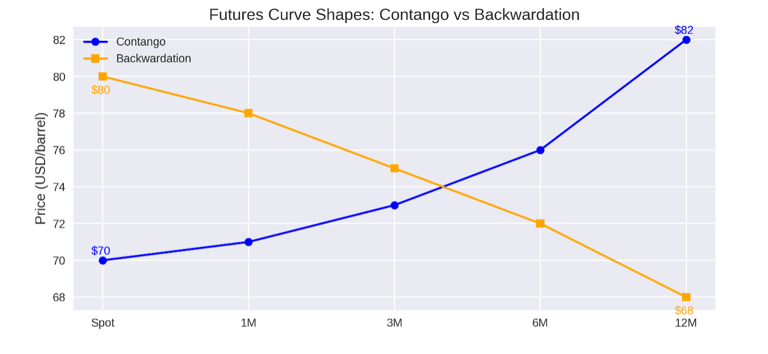
The two futures‑curve shapes with prices at Spot, 1 month, 3M, 6M, and 12M; contango rises from $70 to $82, backwardation falls from $80 to $68. Roll yield is the change in capital when an investor closes a near term contract and buys a longer-term contract, given by the formula
[(near)-(next)]/(near) %
For contango: (70-71)/70 = -1.43% (1 month)
For backwardation: (80-78)/80 = 2.50% (1 month)
Contango has a negative roll yield, signaling that investors will face a loss if they sell near term futures at a lower price and buy next month futures at a higher price. Conversely, backwardation has a positive roll yield, where investors sell near-term futures at a higher price and can buy cheaper next-month contracts.
Contango typically reflects carry costs such as storage, insurance, and financing. When inventories are building, and investors suspect an oversupply, they tend to store barrels in an attempt to sell them at a higher price at a later date. Investors have to account for offsetting storage costs in order to earn profits. Backwardation signals a convenience yield or near‑term tightness. It does not promote oil storage as the spot price of oil is more attractive than the near term price. Producers often sell futures to lock prices (exposed to roll dynamics), and consumers/refiners buy futures and may prefer curve shapes that reduce hedging cost. When contango is wide enough to cover storage and financing, cash‑and‑carry arbitrage becomes profitable and tends to compress the contango.
Connect
info@energizetomorrowus.com
© 2026. All rights reserved.